Difference between revisions of "File:HitChanceVsDistance.png"
Jump to navigation
Jump to search
(A graph showing the dependency of hit chance on distance for different values of accuracy or narrowness of the dispersion cone.) |
(Ant 222 uploaded a new version of "File:HitChanceVsDistance.png") |
(No difference)
| |
Latest revision as of 11:52, 1 September 2016
A graph showing the dependency of hit chance on distance for different values of accuracy or narrowness of the dispersion cone.
File history
Click on a date/time to view the file as it appeared at that time.
| Date/Time | Thumbnail | Dimensions | User | Comment | |
|---|---|---|---|---|---|
| current | 11:52, 1 September 2016 | 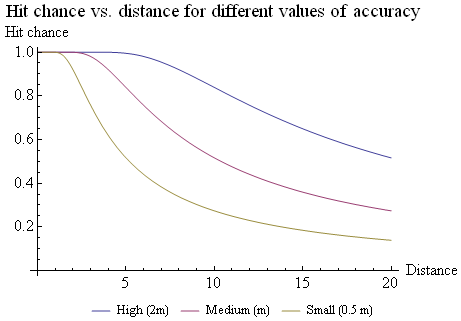 | 461 × 321 (11 KB) | Ant 222 (talk | contribs) | Reduced size. |
| 11:39, 1 September 2016 |  | 667 × 456 (15 KB) | Ant 222 (talk | contribs) | A graph showing the dependency of hit chance on distance for different values of accuracy or narrowness of the dispersion cone. |
You cannot overwrite this file.
File usage
The following page uses this file: